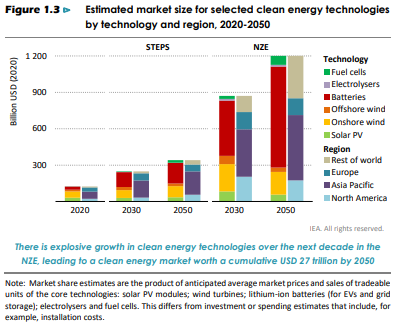
The IEA chart in the exhibit below is another stark reminder of how far away stated policies for clean energy are from what will be needed, and the 2030 gap is the most significant in our view as there is little time to correct it. The IEA has presented several studies over the last year that presents a series of “straw men” examples around how the World and, most recently China, might meet their respective net-zero targets, and the chart below is intended to show how far adrift we are, comparing what is needed to what has been stated. As we have mentioned a couple of times, it would be unusual for companies and countries to have firm plans for 2050 that sum to what the IEA is looking for as there are new technologies under development and the incentive/penalty landscape is still uncoordinated and very unclear. The latter is also a problem looking forward to 2030, but closing the gap between the STEPs scenario and the NZE scenario by 2030 looks almost insurmountable today, without a much tougher and more globally coordinated regulatory landscape, which looks unlikely given some of the low expectations for COP26 specifically. Note that how under the Net-Zero scenario discussed by the IEA, fossil fuel would peak by 2025 and compare this with the EIA analysis that we discuss in today's daily report – there is a huge disconnect.
Net-Zero Pledges Remain Well Below What Is Needed: 2030 Particularly Worrying
Oct 13, 2021 12:27:36 PM / by Graham Copley posted in ESG, Carbon Capture, CCS, Energy, Net-Zero, fossil fuel, IEA, clean energy, COP26, Climate Goals, energy technologies


