

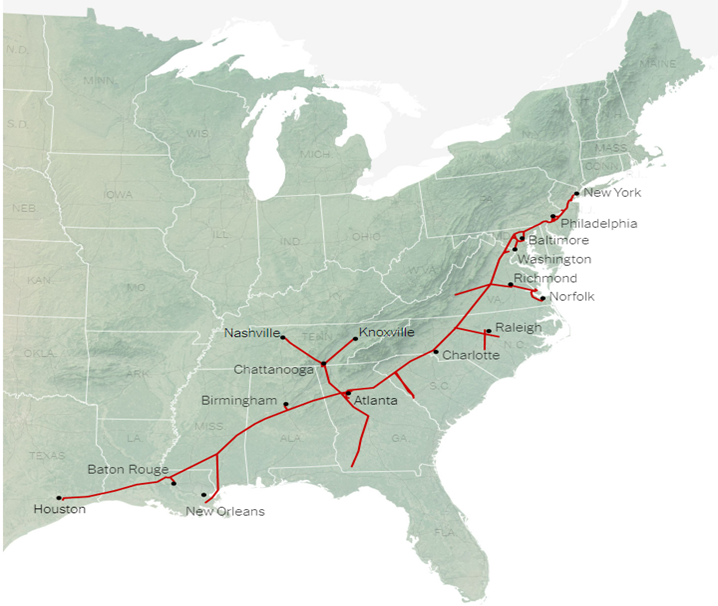
In our ESG and Climate report tomorrow, we will focus on SAF from a carbon intensity perspective. The Colonial pipeline initiative was inevitable given the demand for jet fuel at the East Coast airports. Still, we would not expect much volume to move in the near term for several reasons. First, there is not that much to move, and second, California can still pay more because of the LCFS credit. The Biden administration is planning to introduce a broad SAF credit which would help encourage use outside California, but this would also need to stimulate production as the volumes are still small and much smaller than the airlines would want – even the projection of volumes by bodies like the IEA fall well short of potential airline demand by 2030 and 2040. This is an investable theme, in our view, and we will discuss it in more detail tomorrow.
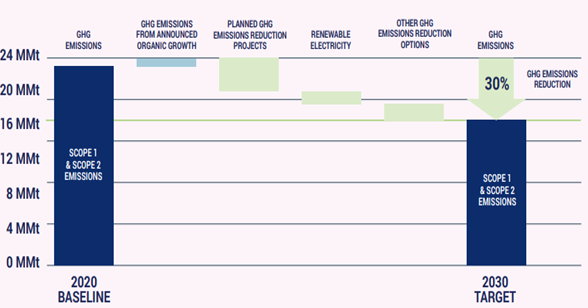
Given the lead time to get some of the emission abatement projects in place – whether it be renewable power or hydrogen with carbon capture – many of the 2030 goals that we see, like the LyondellBasell chart below – are likely to be just that – plans for 2030, with not much in the years in between. We see very little CCS coming online in the US over the next 5 years because of permitting and because of the lead time for any large hydrogen or power project that might be associated with the CCS. Not too many companies seem interested in cleaning up existing CO2 streams and are more interested in building alternative capacity that generates easier to capture CO2 – such as hydrogen from an ATR. These are expensive and long lead-time projects. LyondellBasell, ExxonMobil, Dow, and others might meet their 2030 targets but it might all happen in 2029/30.
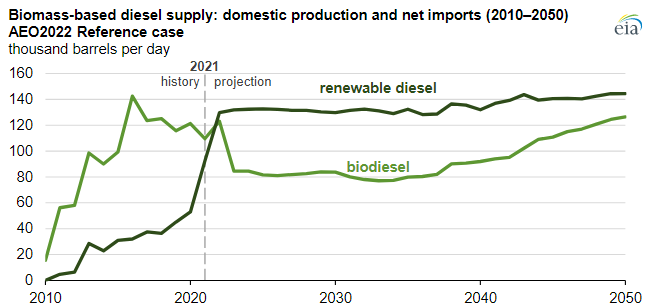
The EIA renewable diesel projections are based on a couple of things – who plans to make it and who will pay for it. All eyes are focused on the California market today as that is where the incentive lies – through the LCFS credit – and production plans plateau associated with that opportunity. As other states in the US adopt similar programs – which seems likely – we would expect to see production plans increase and the EIA will likely adapt its market view model and the chart will change. Note the dominance of renewable diesel over time, and this is where we would expect all future growth to occur. The plug-and-play nature of renewable diesel makes it a far more attractive option for refiners assuming the cost works. See more in today's daily report.
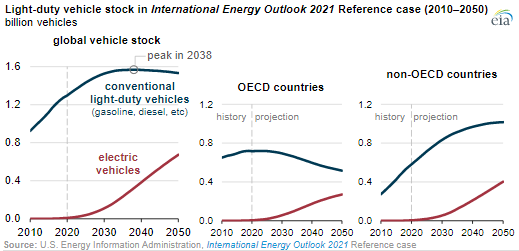
Gevo is racking up the agreements to produce sustainable fuels, announcing deals with Chevron, Axens, and now ADM since September. Our view on the need for sustainable aviation fuel is that everyone building will likely be capital constrained relative to the potential demand – this is also true for sustainable diesel and gasoline, which is relevant given that the EIA sees the conventional light vehicle stock peaking globally as late as 2038 (this is not inconsistent with other estimates we have seen) see chart below.